Sociology: a Timeline of Generations
By Matthieu on Thursday, March 31 2016, 09:57 - Permalink
I've been hearing a lot about "Y Generation" and "Z Gen" lately. When I looked into the topic, it reminded me of an old idea : showing both time and age on a diagram, in order to quickly visualize the age of a person (or generation) at each point of time. The aim was to clarify statements like "I was too young for that back then!".
Historical events are shown in vertical, spanning through the age of affected populations. Events shaping a generation are typically occurring in their 20 years old.
I'm now complementing (crowding?) the diagram with the generations' labels, and few more events. In the XLS sheet I'm compiling researches depicting a profile of each generation.
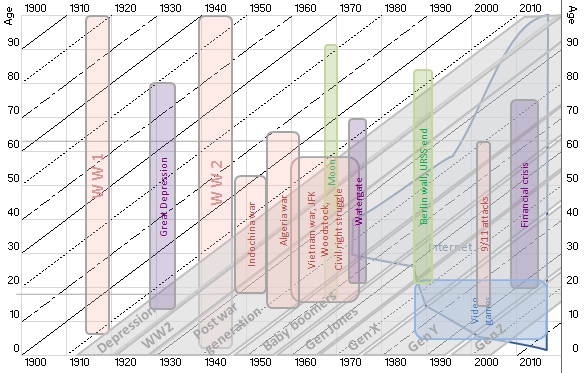
(clicking on the image leads to the XLS file)